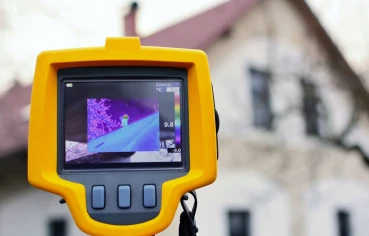
New testing process on control valves
The valves are opened and closed proportionally, and the degree of movement is varied depending on a signal varying between 4 - 20 mA applied to the input. Many valves have a feedback signal that shows the actual position as a percentage open/close value. This output can be a 4 - 20 mA signal or a digital HART variable that represents a 0 - 100 percentage of the control valve operating range.
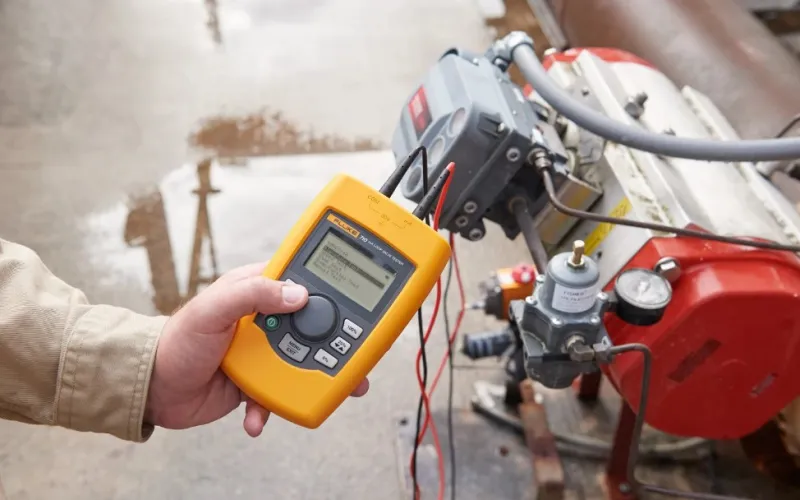
Another important indicator of valve performance is the pressure required by the valve to move to the desired position. For example, a valve can be programmed to know if a 12 mA signal is applied it can open 50%. Smart electronics will control whether a smart pressure regulator is needed to increase or decrease the pressure when needed to move the control element to the desired position.
Providing a varying mA signal while monitoring the output milliamps or percentage of the trip signal will tell you whether a control valve is operating properly over its working range. Similarly, monitoring and recording the pressure applied to the final control elements while varying the 4 - 20 mA input signal to the valves is an important test to identify whether a valve is stuck. The relationship between pressure and mA or valve position will usually be linear if the valve is operating properly. If additional pressure is required it can often be considered for a stuck valve and will be shown if the measurement is recorded and plotted on a graph. By recording these signals, valve performance can be documented. These documented tests and results are usually called valve “characteristics”.
The valve usually includes a simple manual indicator that gives you an estimate of the percentage of movement to determine when it is operational. However, this indicator does not show you how the valve will operate under dynamic and changing conditions, and its accuracy is not guaranteed.