
Measuring Tools
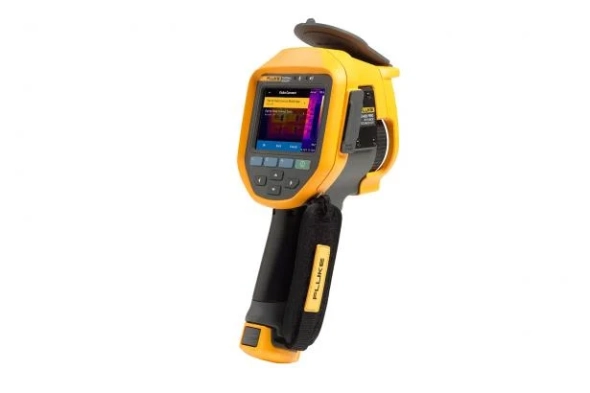
Fluke Ti480 PRO Infrared Camera
Increased sensitivity to visualize differences
- Capture smaller temperature differences with increased thermal sensitivity
It's easier to visualize and diagnose problems
- Images on the screen are getting sharper with better color differences
- Display deviations from standard temperature and communicate concerns to your team using multiple Delta-T markers - select one as a reference point and another to display differences
- Multiple square markers on camera - identify min/max temperature for equipment area or equipment array
- Determine heat differences more easily with the new palette and wider array of yellows and greens on screen
Download
Produk Lainnya
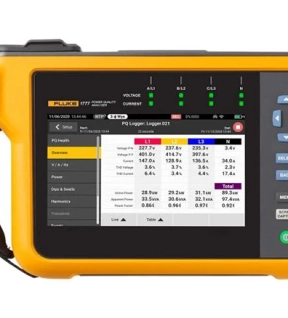
Automatic measurement. Higher flexibility. Better power quality troubleshooting.
The Fluke 1770 Series Three-Phase Power Quality Analyzer takes the hassle out of power quality logging, troubleshooting, and analysis. Designed to be a faster and easier way to conduct power quality studies, the 1770 Series offers automatic measurements, a simple user interface and setup, best-in-class specifications, and a simpler reporting platform. The instrument can also be powered directly from the measuring circuit, eliminating the need to find an electrical outlet or use long extension cords
With the 1770 Series, you'll never miss critical power quality events—from fast transients up to 8 kV, harmonics up to 30 kHz, dips and swells, and voltage, current, and power measurements that let you understand your electrical system.
Automatic measurement recording
Whether you're doing a quick system check or a detailed power quality study, consistent data is key. The Fluke 1770 Series offers a unique automated measurement taking system that helps ensure you collect the right data every time, while giving you the flexibility to select and adjust certain parameters as needed. Over 500 power quality parameters are recorded by default and guided setup makes it easy to select the right parameters for the system you are working with. Logged data is instantly viewable, downloadable, and shareable with the Fluke Energy Analyze Plus software so you don't have to wait to finish your session before reviewing results or analyzing data
Best measurement confidence
The Fluke 1770 Series is a 2-in-1 device that combines the troubleshooting functionality of a power quality meter with the powerful analysis and logging capabilities of a standalone power quality analyzer—in one easy-to-use handheld device.
The 'Power Quality Meter' function gives you direct access to live data on the screen while in the field, so you can quickly identify potential problems when troubleshooting. The detailed 'Power Quality Logging and Analysis' function takes the hassle out of performing a power quality assessment by guiding you through the setup process to ensure you are capturing the right data every time. Combine these various measurement modes with the unique metering connection auto-correction function, and you can rest assured you won't have to go back for a second measurement—even if you weren't sure what to look for when you started.
Powerful analysis software with easy-to-generate reports
The Fluke 1770 Series Power Quality Analyzers are equipped with the powerful Fluke Energy Analyze Plus software. This software is designed to take the hassle out of other multi-purpose application software. Energy Analyze Plus helps you easily evaluate power quality data, without the need for lengthy training.
Energy Analyze Plus makes it easy to download, analyze, track and report on power quality and energy data. Quickly compare results to historical values, benchmark against industry norms, compare measured data to local conditions, and create a more complete picture of what's happening across your facility, even while data is still being collected. Energy Analyze Plus offers integrated support for the Fluke 1730, 1740, and 1770 Series of Energy Loggers and Power Quality Analyzers.
“In-workshop” and “in-the-field” setup and download via PC application software
- Simple data download using a USB memory stick, WiFi, LTE, Ethernet cable or USB cable
- Analyze every detail of energy consumption and power quality health status with automatic reports
- One-touch reporting creates standardized reports that comply with standards such as EN 50160, IEEE 519, GOST 33073 IEC 61000-2-2, or export data in PQDIF or NeQual or CSV compatible formats for use with third-party software
- Advanced analysis allows users to select recorded parameters and create highly customized measurement views for advanced data correlation
Power Quality
High speed voltage transient recording
Transients negatively affect a healthy system every day and their potential to damage your equipment should not be underestimated. Whether your system experiences impulsive or oscillating transients, the results can be catastrophic and result in problems ranging from insulation failure to total equipment failure. The Fluke 1775 and Fluke 1777 feature advanced transient recording technology to help you clearly identify high-voltage transient conditions, so you have the data you need to stop them. The Fluke 1775 Power Quality Analyzer has 1 MHz sampling capability to record fast transients, while the Fluke 1777 Power Quality Analyzer has 20 MHz sampling capability to record the fastest transients in high detail.
From conventional industrial systems to renewable energy systems to electric vehicles, we have the tools
The Fluke 1770 Series is designed to be safe and easy to use in any measurement environment. The 1770 Series lets you record a variable range of full power quality as well as high speed waveforms, high speed transients and higher frequency harmonics. Everything can be seen directly on the large high-resolution screen. With best-in-class CAT IV 600 V / CAT III 1000 V overvoltage ratings, this analyzer can be used in mains or downstream input receivers, measuring AC and DC inputs, as well as measuring harmonics up to 30 kHz. With the 1770 Series, you can rest assured that you will capture the data you need to make better maintenance decisions, whatever the task.
In accordance with international standards
The Fluke 1770 Series offers the best-in-class accuracy you expect from a Fluke Power Quality Analyzer in a package that meets IEC 61000-4-30 Class A next edition 3. In addition, the 1770 Series has been designed to meet the requirements of the upcoming Class A edition, to comply with EN 50160 and IEEE 519, so you are well prepared to address your future measurement needs.
Work where, when, and how you want
The situation on the ground is different every day. You need a power quality analyzer that you can always carry with you and work the way you need it. With a wide range of accessories and built-in features, the Fluke 1770 Series makes it easy to get the job done. The slim ergonomic design and integrated wrist strap make it easy to hold and the included hanging kit makes it easy to store your analyzer in the cabinet. The integrated internal power supply allows the unit to be powered directly from a rated circuit, while a 90-minute battery helps ensure you can still access and review data even when not connected to a live system.
Transfer data quickly and easily to your PC using USB C, USB A, Ethernet, Wi-Fi, or mobile network support options, depending on your needs. With the built-in GPS module and optional dual isolation antenna extension cable to amplify indoor GPS signals, you can easily synchronize your data with the time for more accurate troubleshooting and analysis.
Calculate current harmonic limits
When downloading data from the Fluke 1770 Series Power Quality Analyzer, the included Energy Analyze Plus software package can compare rated voltage and current harmonics statistical data against various standards, such as EN 50160 or IEEE 519. This is to determine if the data exceeds compliance limits. . With this advanced predictive maintenance feature, current harmonics can be spotted before distortions in voltage appear, so you can prevent unexpected failures or inappropriate situations and increase system uptime. With inverter-based loads and power generation increasing, keeping current harmonics in line is becoming increasingly important to ensure reliable power quality and avoid system downtime.
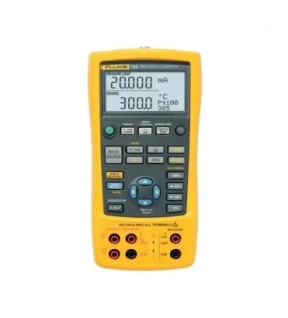
Process calibration designed specifically for process industries
The Fluke 726 is a precise and powerful, yet easy-to-use, field calibrator. It features broad workload coverage, calibration power, and unsurpassed accuracy needed by process professionals. It measures and sources almost all process parameters to calibrate almost anything. Use it to test sensors and valves, and to test and calibrate transmitters. The 726 interprets results without the help of a calculator and stores measurement data for later analysis.
Measurement capabilities
This precision multifunction calibrator measures volts, mA, pressure, RTDs, thermocouples, frequency, and resistance to test sensors and transmitters. The 726 also sources and simulates volts, mA, thermocouples, RTDs, frequency to calibrate transmitters. Measures and/or sources pressure using when paired with any of the 50 Fluke 750P series Pressure Modules to test and calibrate pressure transmitters and other devices. The 726 can also:
- Source mA with simultaneous pressure measurement to conduct valve and I/P test
- Conduct enhanced flowmeter testing with frequency totalizer and frequency pulse train source mode
Designed for ease of use
The 726 has built-in features that make it easier to use in nearly any measurement situation. From its ability to store frequently used test setups, to programming custom RTD probe calibration constants for enhanced temperature measurement, or the integrated voltage input protection design that improves reliability, the 726 is built to perform. The use of two separate channels even allows you to measure, source, or view process signals simultaneously. The backlit display provides better visibility in low-light conditions, and the standard 3-year warranty provides extra confidence that the 726 will be there when you need it to be.
You can also use the 726 to:
- Capture the set, reset, and deadband of a pressure switch with the integrated switch test
- Calculate the transmitter error % to interpret calibration results without the use of a calculator
- Perform fast linearity tests with the auto-step and auto-ramp features
- Power a transmitter during test using 24 V loop supply and simultaneous mA measurement
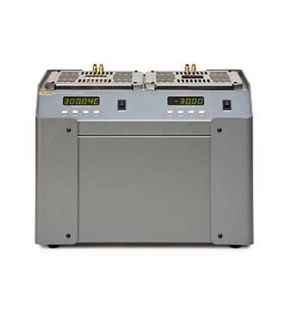
Widest temperature range available in a single dry-well
• Combined range from –30 °C to 670 °C, one unit – two blocks
• Two independent temperature controllers (hot and cold side)
• Stability to ±0.02 °C
• Multi-hole wells for calibrating up to eight probes simultaneously
To give you the widest temperature range available in a dry-well calibrator, we’ve combined two of our most popular units. The 9011 allows temperature probes to be calibrated from –30 °C to 670 °C in a single unit.
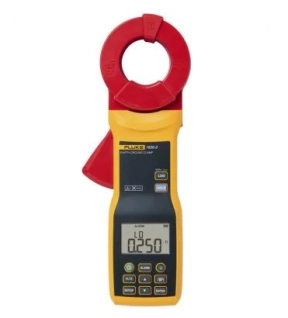
The Fluke 1630 is a MUST HAVE for those who are intent on improving the reliability of their systems and making it impervious to impulse damage. The Fluke 1630 is easy to use, highly accurate and an industry standard”- verified purchaser
The 1630-2 FC clamp measures earth ground loop resistances for multi-grounded systems using the dual-clamp jaw. This test technique eliminates the dangerous and time-consuming activity of disconnecting parallel grounds, as well as the process of finding suitable locations for auxiliary test stakes. You can also perform ground tests in places that were previously difficult: inside buildings, on power pylons or anywhere you don't have access to soil to place auxiliary test stakes.
Earth ground ac leakage current measurement
- Identify ac leakage currents without disconnecting the earth ground stake from the grounding system–ideal for system troubleshooting.
- Rugged heavy-duty clamp jaw stays in alignment and in calibration even in every day, on-the-job industrial environments.
Logging measurements
- The earth ground clamp saves time by automatically recording data at pre-set intervals
- Saves up to 32,760 measurements in memory at the set logging interval.
- Saves time by recording and storing measured values.
Alarm threshold
- User-defined high/low alarm limits, for rapid measurement evaluation.
Band-pass filter
- Selectable band-pass filter function removes unwanted noise from the ac leakage current measurement.
Fluke Connect® Wireless System
- The 1630-2 FC supports the Fluke Connect Wireless System connects the clamp with an app on your smartphone or tablet (may - not be available in all regions).
- You can save these measurements, and images to Fluke Connect Cloud storage and share with your team.
- Maximize uptime and make confident maintenance decisions with data you can trust and trace.
- Access baseline, historical and current measurements by asset.
- Share your measurement data using ShareLive™ video calls and emails.
- The 1630-2 FC is part of a growing system of connected test tools and equipment maintenance software. Visit the website to learn more about the Fluke Connect system.